
Top 12 Website Performance Monitoring Tools for 2025


In the current online marketplace, a slow website doesn't just frustrate users; it actively hurts your bottom line. Every millisecond counts, impacting everything from search engine rankings and user engagement to conversion rates and brand reputation. For small businesses in Sacramento, marketing leaders, and e-commerce brands alike, a sluggish site means lost leads and revenue. But how do you stay ahead of performance bottlenecks, ensure ADA compliance, and maintain a seamless user experience? The answer lies in proactive monitoring.
- Website performance monitoring tools track uptime, page speed, and Core Web Vitals to prevent costly downtime.
- Combining synthetic monitoring with real user monitoring (RUM) gives you the most complete performance picture.
- Tools range from free options like UptimeRobot to enterprise platforms like Datadog and Dynatrace.
This guide dives deep into the best website performance monitoring tools available, moving beyond generic feature lists to provide a practical, in-depth analysis. We're cutting through the marketing copy to give you a clear, honest assessment of what works and what doesn't. You'll get a comprehensive breakdown of each platform, including its specific strengths, potential limitations, and ideal use cases. This isn't just another list; it's a strategic resource designed to help you make an informed decision.
We will explore a curated selection of tools, from the comprehensive monitoring of SolarWinds Pingdom and Datadog to the granular, on-demand analysis of GTmetrix and WebPageTest. For each tool, you will find:
- A concise overview of its core function.
- An analysis of key features and implementation considerations.
- Clear pros and cons based on real-world application.
- Specific pricing tiers and screenshots for context.
Our goal is simple: to equip you with the knowledge to select the right website performance monitoring tools for your specific needs, whether you're a local service provider in El Dorado Hills aiming for better local SEO or a national e-commerce brand focused on maximizing conversions. Let's find the solution that will keep your site fast, reliable, and profitable.
1. SolarWinds Pingdom
SolarWinds Pingdom is a well-regarded name in the website performance monitoring tools space, striking an effective balance between powerful features and user-friendly design. It's particularly strong for small to mid-sized businesses (SMBs) and marketing teams who need clear, actionable data without a steep learning curve. The platform combines synthetic monitoring with Real User Monitoring (RUM) to provide a holistic view of your site's health.
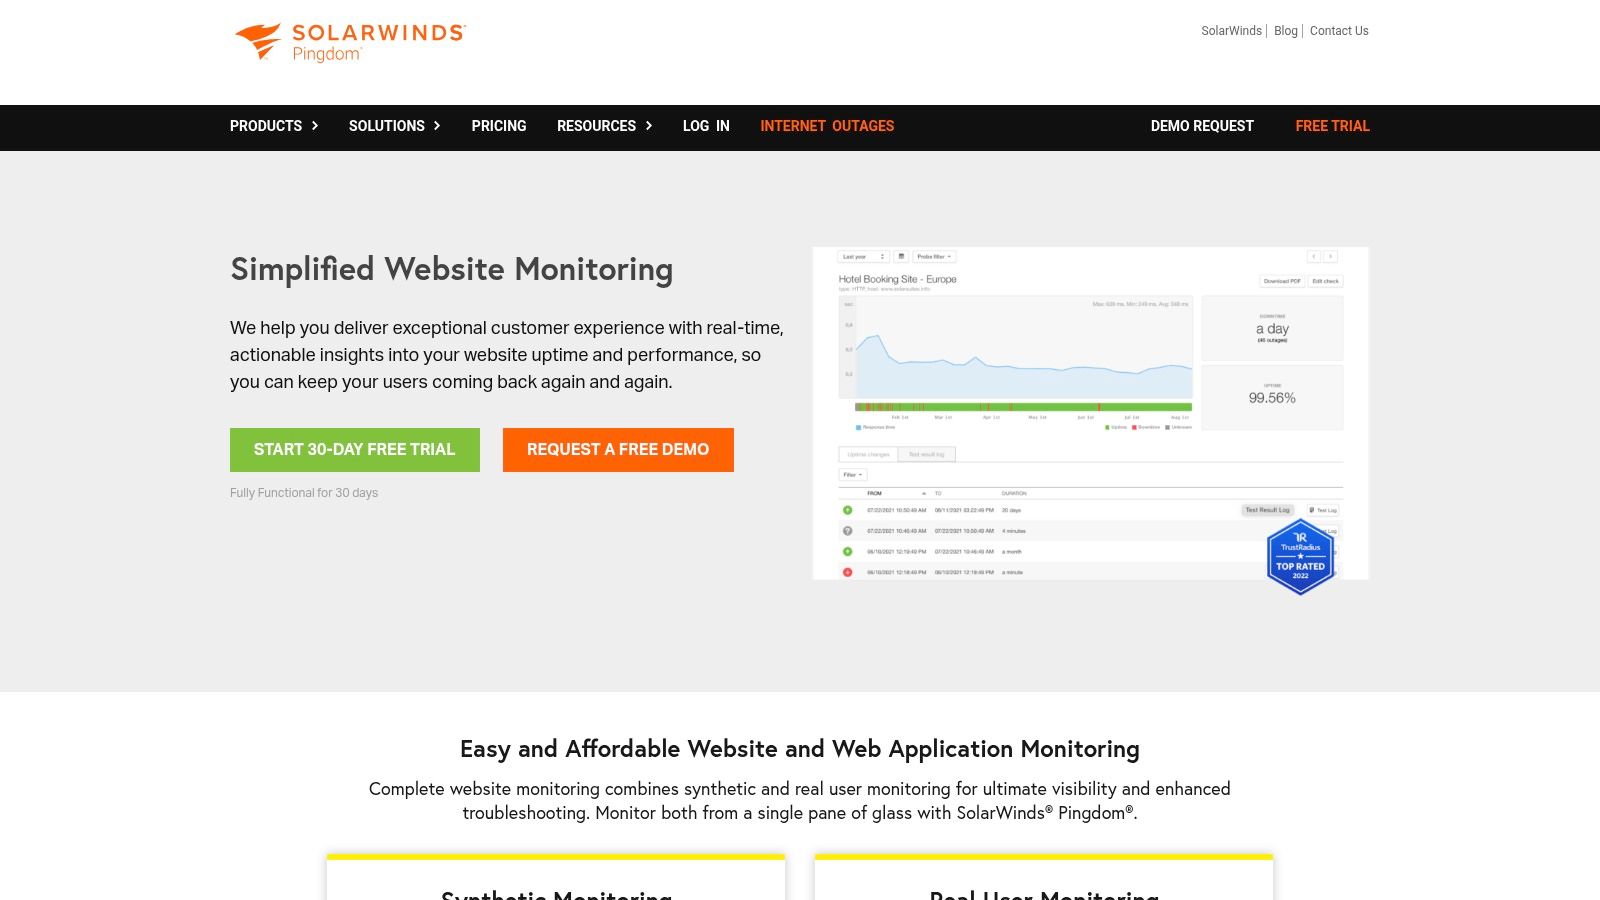
Pingdom excels at simplifying complex performance data. Its uptime monitoring uses a global network of over 100 probes to check your site's availability from various locations, minimizing false positives. The page speed analysis provides a waterfall chart that helps identify specific assets (like large images or slow scripts) that are bogging down load times.
Key Features & Ideal Use Case
Pingdom is ideal for businesses that need to track core performance metrics and quickly alert relevant teams to downtime or slowdowns. The transaction monitoring is a standout feature, allowing you to simulate multi-step user journeys like a login process or a checkout flow to ensure critical paths are always functional.
- Synthetic Monitoring: Proactively test uptime, page speed, and transactions from global locations.
- Real User Monitoring (RUM): Collect performance data from actual visitors to understand real-world experience across different browsers, devices, and regions.
- Alerting: Customizable alerts via email, SMS, and integrations with services like Slack and Opsgenie.
- Public Status Pages: Create a public-facing page to communicate uptime and incident status to your customers.
Pros:
- Simple and intuitive user interface.
- Strong reporting capabilities are easy for non-technical stakeholders to understand.
- Robust and geographically diverse probe network for accurate uptime checks.
Cons:
- The pricing model can become complex as you add more checks or features.
- SMS alert credits are a separate cost that can add up for high-volume alerting.
Website: https://www.pingdom.com
2. Datadog Synthetic Monitoring
Datadog Synthetic Monitoring is a powerful component of a broader observability platform, making it a top choice for development, operations, and SRE teams already invested in the Datadog ecosystem. It moves beyond simple uptime checks to provide comprehensive API, browser, and mobile application testing. This tool is designed for cloud-native environments and enterprises that need to correlate synthetic test results with backend performance metrics, logs, and infrastructure health in a single, unified view.
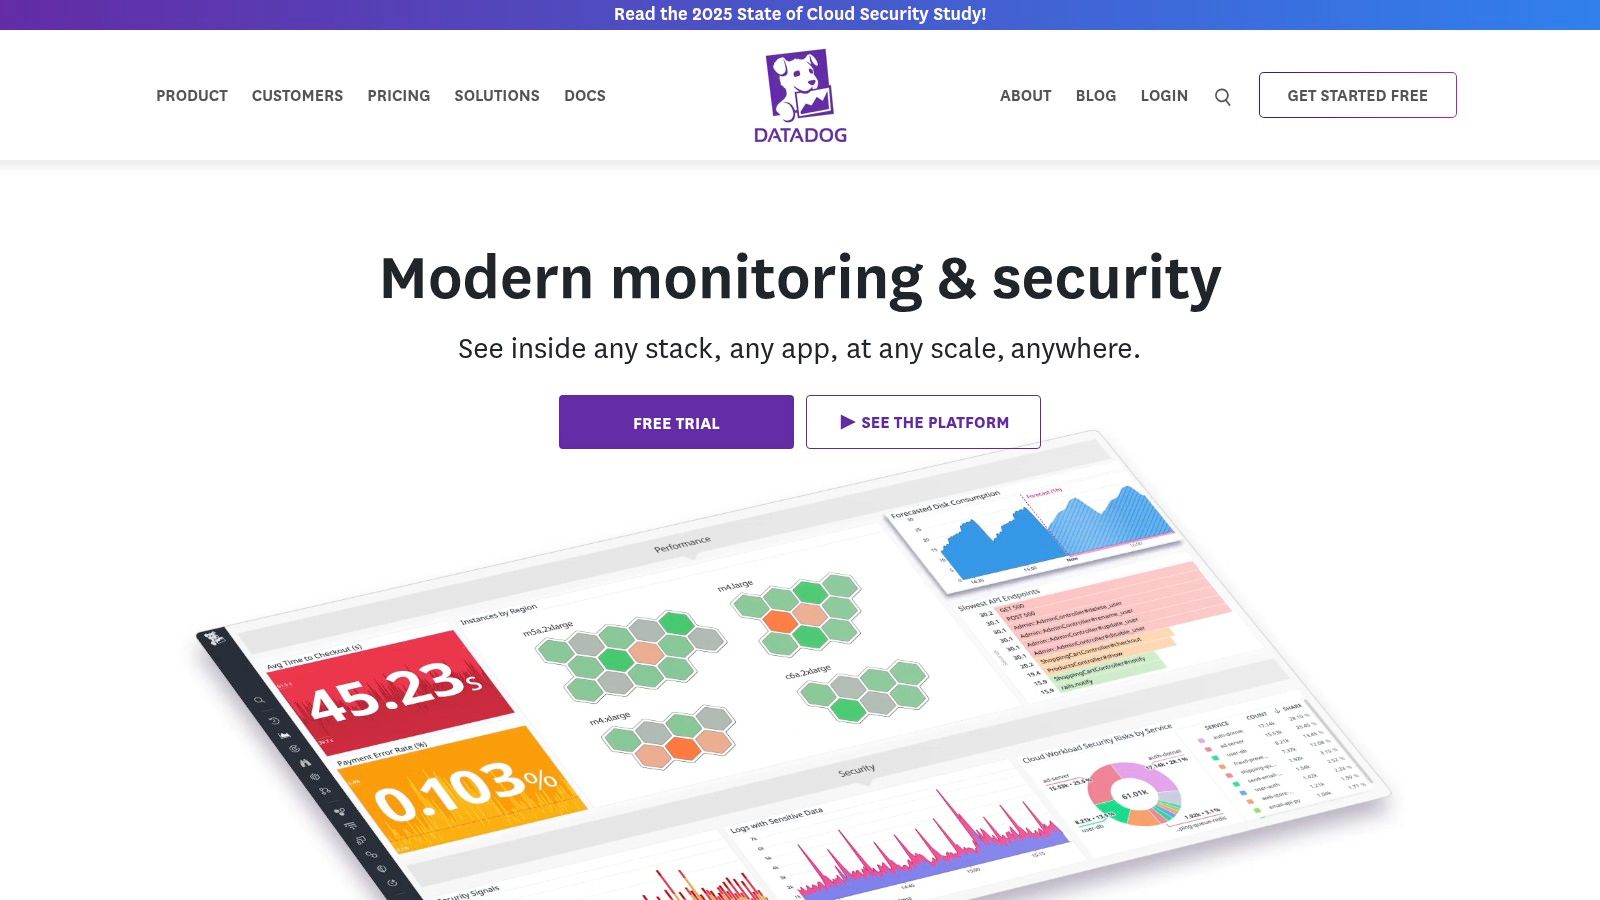
What sets Datadog apart is its deep integration. A failed browser test can be instantly correlated with a spike in CPU usage on a specific server, a database query log, or an application error trace. This seamless workflow dramatically reduces the mean time to resolution (MTTR) by eliminating the need to switch between different website performance monitoring tools to diagnose an issue.
Key Features & Ideal Use Case
Datadog is ideal for technical teams that require a proactive, end-to-end view of their application's performance. The no-code test recorder allows for the quick creation of complex browser tests that simulate user journeys. These tests can then be run from global locations and tied directly to service-level objectives (SLOs) and service-level agreements (SLAs) for robust alerting.
- Integrated Monitoring: Combines synthetic tests with APM, logs, and infrastructure metrics for full-stack visibility.
- No-Code Test Creation: A web recorder simplifies the process of creating multi-step browser tests.
- Detailed Failure Analysis: Captures waterfall charts, screenshots, and console errors to help debug issues quickly.
- SLO/SLA-Based Alerting: Integrates alerts with service level objectives to focus on what matters most to the business.
Pros:
- Unparalleled integration with over 850+ services and the rest of the Datadog platform.
- Highly customizable and powerful dashboarding capabilities.
- Scales effectively to meet the complex needs of large enterprises.
Cons:
- The modular, usage-based pricing can become expensive quickly.
- The initial setup and learning curve can be steep for teams new to the platform.
Website: https://www.datadoghq.com
3. New Relic (Synthetics + Browser/RUM)
New Relic has evolved into a full-stack observability platform, making it one of the most comprehensive website performance monitoring tools available. It's an excellent choice for engineering-led teams and organizations that want to consolidate their monitoring into a single solution, combining synthetic checks, browser-based Real User Monitoring (RUM), and backend application performance monitoring (APM) in one unified interface. The platform is designed to correlate frontend user experience with backend performance, providing deep insights into the entire request lifecycle.
What sets New Relic apart is its incredibly generous free tier and usage-based pricing model. This approach allows smaller teams to access enterprise-grade tools without a prohibitive upfront cost. Instead of paying per host or per feature, you pay for the data you ingest, with a substantial free monthly allowance. This makes it accessible for startups and powerful enough for large enterprises, allowing the platform to scale with your needs.
Key Features & Ideal Use Case
New Relic is ideal for teams that need to diagnose complex performance issues that span from the user's browser all the way to the database. It excels at connecting the dots between a slow page load time (reported by Browser/RUM) and a specific, inefficient database query on the backend (identified by APM), a capability many other tools lack.
- Full-Stack Observability: Unify logs, traces, metrics, and user experience data in a single platform.
- Synthetic Monitoring: Includes simple ping checks, browser simulations, and API tests, with 500 free checks per month on the free tier.
- Browser Monitoring (RUM): Measures real user performance, including Core Web Vitals, page load times, and JavaScript errors.
- Generous Free Tier: Provides 100 GB of free data ingest per month and one full-platform user, which is sufficient for many small projects.
Pros:
- Extremely powerful and generous free tier for getting started.
- Consolidated toolset reduces vendor sprawl and simplifies workflows.
- Flexible pay-as-you-go pricing scales with your actual usage.
Cons:
- Usage-based costs can be unpredictable and require careful monitoring to avoid surprises.
- The sheer number of features can present a steep learning curve for new users.
Website: https://newrelic.com
4. Dynatrace (Digital Experience Monitoring: RUM + Synthetic)
Dynatrace is an enterprise-grade, AI-driven observability platform that offers comprehensive website performance monitoring tools as part of its full-stack solution. It is engineered for large, complex environments where deep, automated analysis is critical. The platform’s strength lies in its ability to automatically discover and map an entire technology stack, using its AI engine, Davis, to provide answers and pinpoint root causes rather than just presenting raw data.
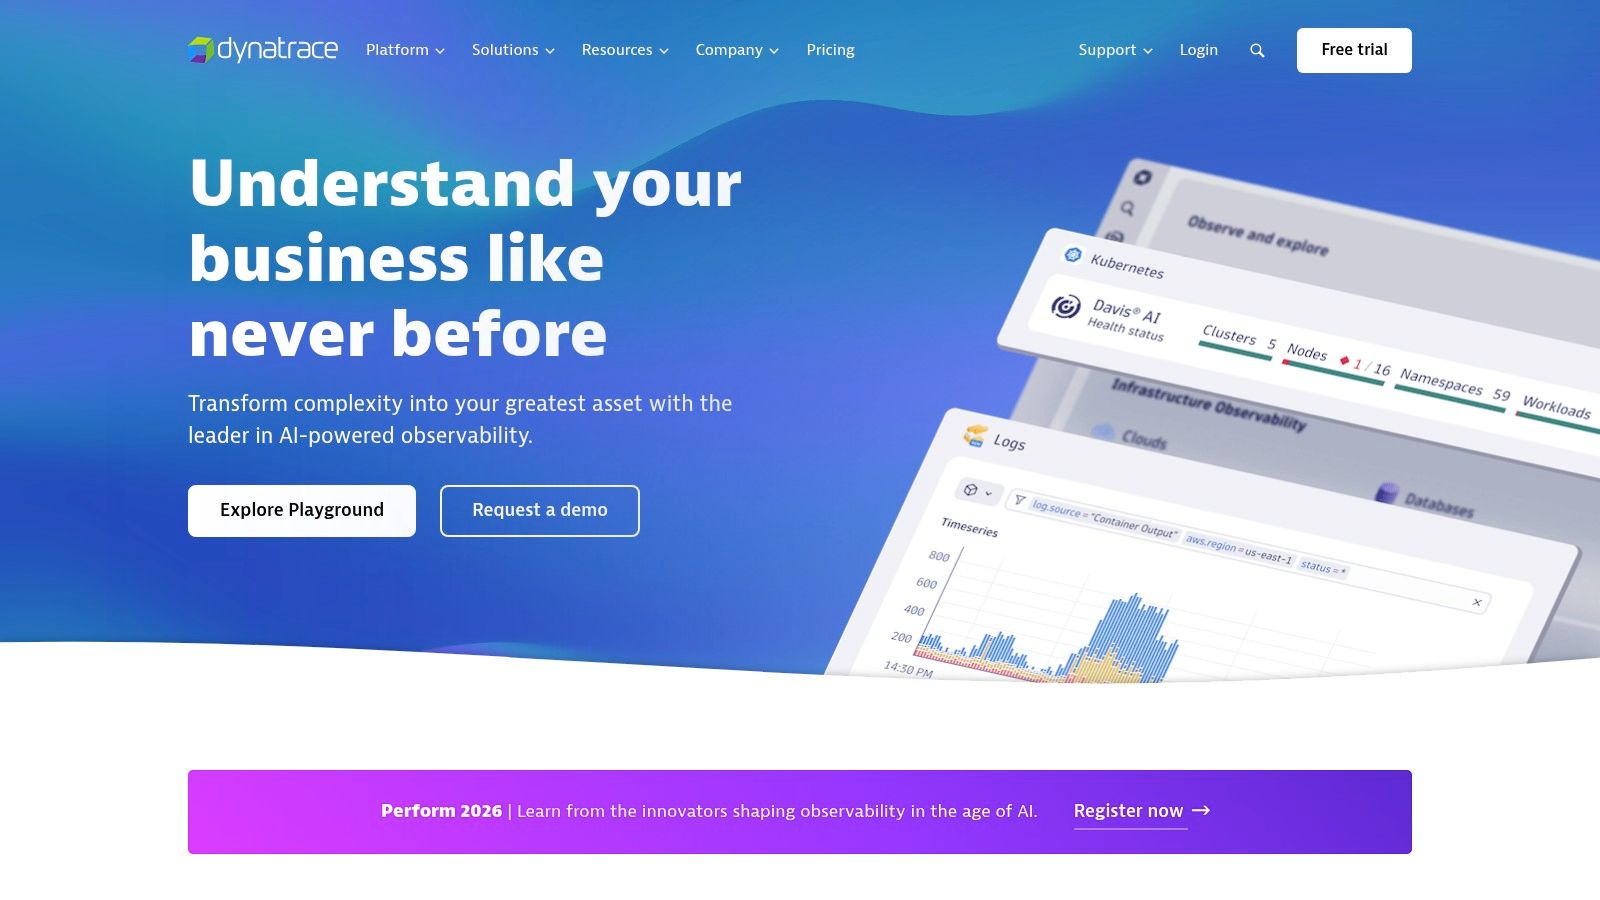
This tool excels at connecting user experience directly to backend performance. Its Digital Experience Monitoring combines Real User Monitoring (RUM) with synthetic tests to deliver a complete picture of application health. The OneAgent deployment simplifies data collection, automatically capturing everything from user clicks to database queries, making it a powerful solution for teams needing to resolve issues quickly in intricate ecosystems.
Key Features & Ideal Use Case
Dynatrace is ideal for large enterprises and DevOps teams that require end-to-end observability and automated root-cause analysis across hybrid and multi-cloud environments. Its ability to correlate front-end user sessions with back-end infrastructure performance makes it invaluable for organizations where application downtime has significant revenue impact.
- AI-Powered Root Cause Analysis: The Davis AI engine automatically identifies the precise cause of performance issues.
- Full-Stack Observability: OneAgent technology provides deep insights into infrastructure, applications, and user experience with a single deployment.
- Real User Monitoring (RUM): Includes session replay capabilities to visually reconstruct user journeys and identify frustration points.
- Synthetic Monitoring: Simulate user journeys and API calls with browser clickpaths and HTTP monitors from global locations.
Pros:
- Extremely deep, granular analytics across the entire technology stack.
- Powerful AI-driven automation significantly reduces manual troubleshooting time.
- Transparent, consumption-based pricing model.
Cons:
- Can be overly complex for smaller businesses or simple websites.
- Costs can scale quickly with high data volume due to the pay-as-you-go model.
Website: https://www.dynatrace.com
5. Site24x7
Site24x7 offers one of the broadest suites of services among website performance monitoring tools, positioning itself as an all-in-one observability platform. It goes beyond standard website checks to include server, network, application performance (APM), and log management, making it an excellent choice for businesses wanting to consolidate their monitoring stack into a single, cost-effective solution. Its strength lies in its comprehensive coverage, appealing to IT teams that manage the entire infrastructure, not just the website.
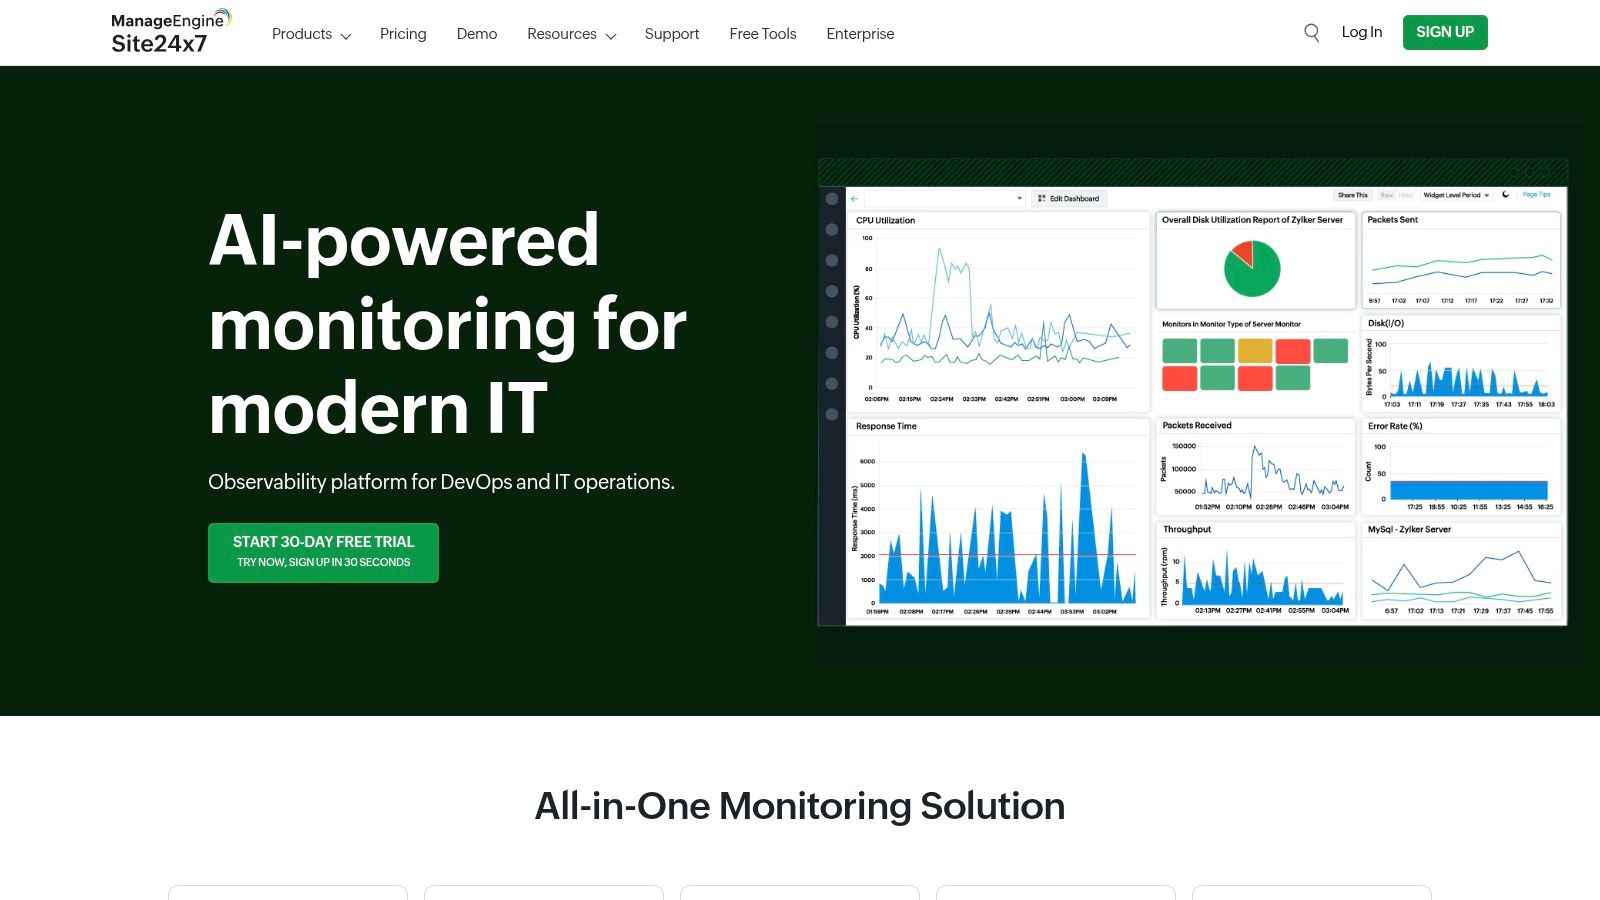
The platform’s monitoring capabilities are extensive. Synthetic transaction monitoring is powered by a global network of over 130 locations, ensuring accurate performance data from your key customer regions. Its Real User Monitoring (RUM) is bundled with generous pageview allowances, providing deep insights into how actual users experience your site's speed and availability across various devices and browsers.
Key Features & Ideal Use Case
Site24x7 is ideal for small to mid-sized businesses (SMBs) and IT departments that need a powerful, integrated monitoring tool without the enterprise-level price tag. The platform’s value shines when you utilize its full spectrum of monitoring, from website uptime to server CPU load, all within a single dashboard. It's a pragmatic choice for teams that need to correlate website performance with underlying infrastructure health.
- All-in-One Monitoring: Combines website, server, network, APM, and log monitoring in one platform.
- Global Synthetic Monitoring: Test website availability and multi-step transactions from 130+ global locations.
- Real User Monitoring (RUM): Analyze front-end performance based on real visitor data.
- Status Pages & Alerting: Includes public status pages and alert credits, with integrations for Slack, Microsoft Teams, and PagerDuty.
Pros:
- Highly competitive and transparent pricing.
- Comprehensive, all-in-one monitoring coverage simplifies vendor management.
- A generous free-forever plan is available for basic uptime monitoring.
Cons:
- The plan matrix can be dense and complex to navigate.
- Careful attention is needed for add-on costs like extra SMS credits or pageview bundles.
Website: https://www.site24x7.com
6. Uptrends
Uptrends offers a comprehensive suite of website performance monitoring tools, distinguishing itself with an extensive global network and a particularly user-friendly approach to synthetic monitoring. It serves as an excellent entry point for teams new to Digital Experience Monitoring (DEM), providing powerful capabilities like transaction recording and API monitoring without a steep learning curve. The platform effectively balances synthetic checks with Real User Monitoring to paint a full picture of site health and end-user satisfaction.
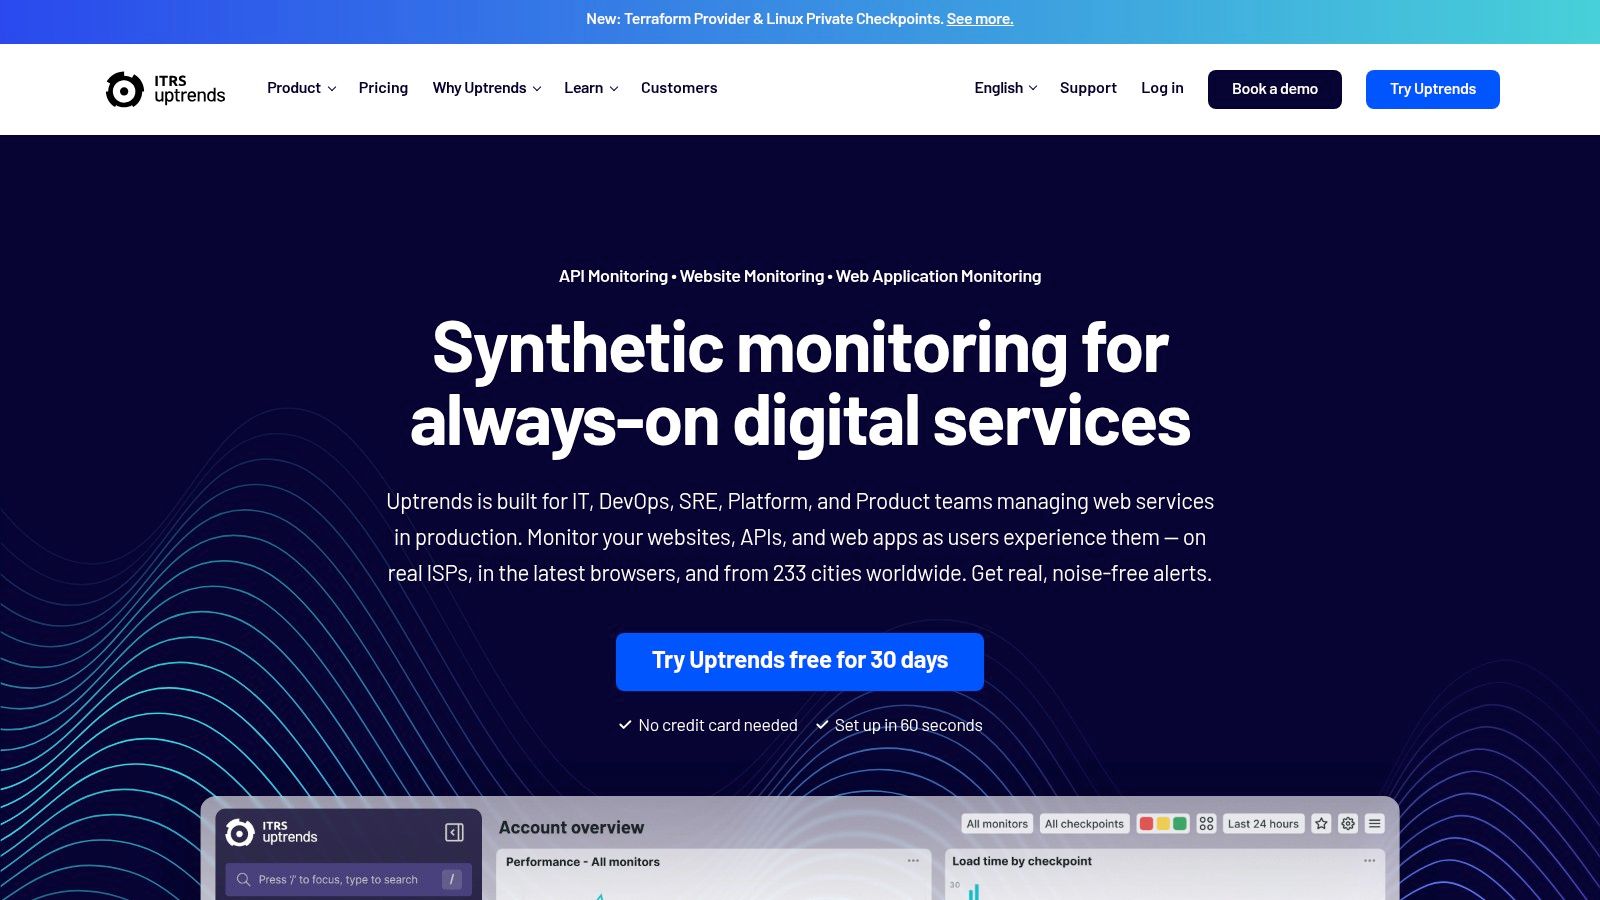
A key advantage of Uptrends is its vast network of over 230 global checkpoints, which ensures highly accurate uptime and performance data from your users' actual locations. The platform's transaction recorder simplifies the process of building multi-step user journey tests, allowing you to simulate critical flows like sign-ups or shopping cart checkouts with ease. Its browser monitoring captures detailed waterfall charts and filmstrip screenshots, helping pinpoint the exact moment a performance issue occurs.
Key Features & Ideal Use Case
Uptrends is ideal for businesses that need robust global monitoring coverage and want to easily create and manage complex synthetic tests. Its combination of web, API, and real user monitoring makes it a versatile choice for DevOps and IT teams looking to get ahead of performance issues before they impact customers. The clear SLA reporting also makes it valuable for demonstrating reliability to stakeholders.
- Global Monitoring Network: Leverage over 230 worldwide checkpoints for accurate, location-specific performance testing.
- Synthetic Monitoring: Build complex transaction scripts with an easy-to-use recorder and monitor API endpoints.
- Real User Monitoring (RUM): Capture performance data from real visitors to understand how your site performs across various browsers and devices.
- Browser Monitoring & Filmstrips: Visualize page load performance with detailed waterfall charts and screenshot timelines.
Pros:
- Intuitive user interface that is easy to navigate.
- Extensive global checkpoint network provides highly accurate results.
- A great starting point for businesses venturing into digital experience monitoring.
Cons:
- The credit-based pricing model can be confusing and requires careful planning to manage costs.
- Some advanced features are bundled in higher-tier plans, which may increase the cost.
Website: https://www.uptrends.com
7. UptimeRobot
UptimeRobot is one of the most accessible and cost-effective website performance monitoring tools, making it a go-to choice for solo developers, bloggers, and small businesses. It focuses on the core essential of monitoring: knowing when your site is down. While it doesn't offer the deep application performance metrics of more complex platforms, its simplicity is its greatest strength, allowing anyone to set up crucial availability checks in minutes.
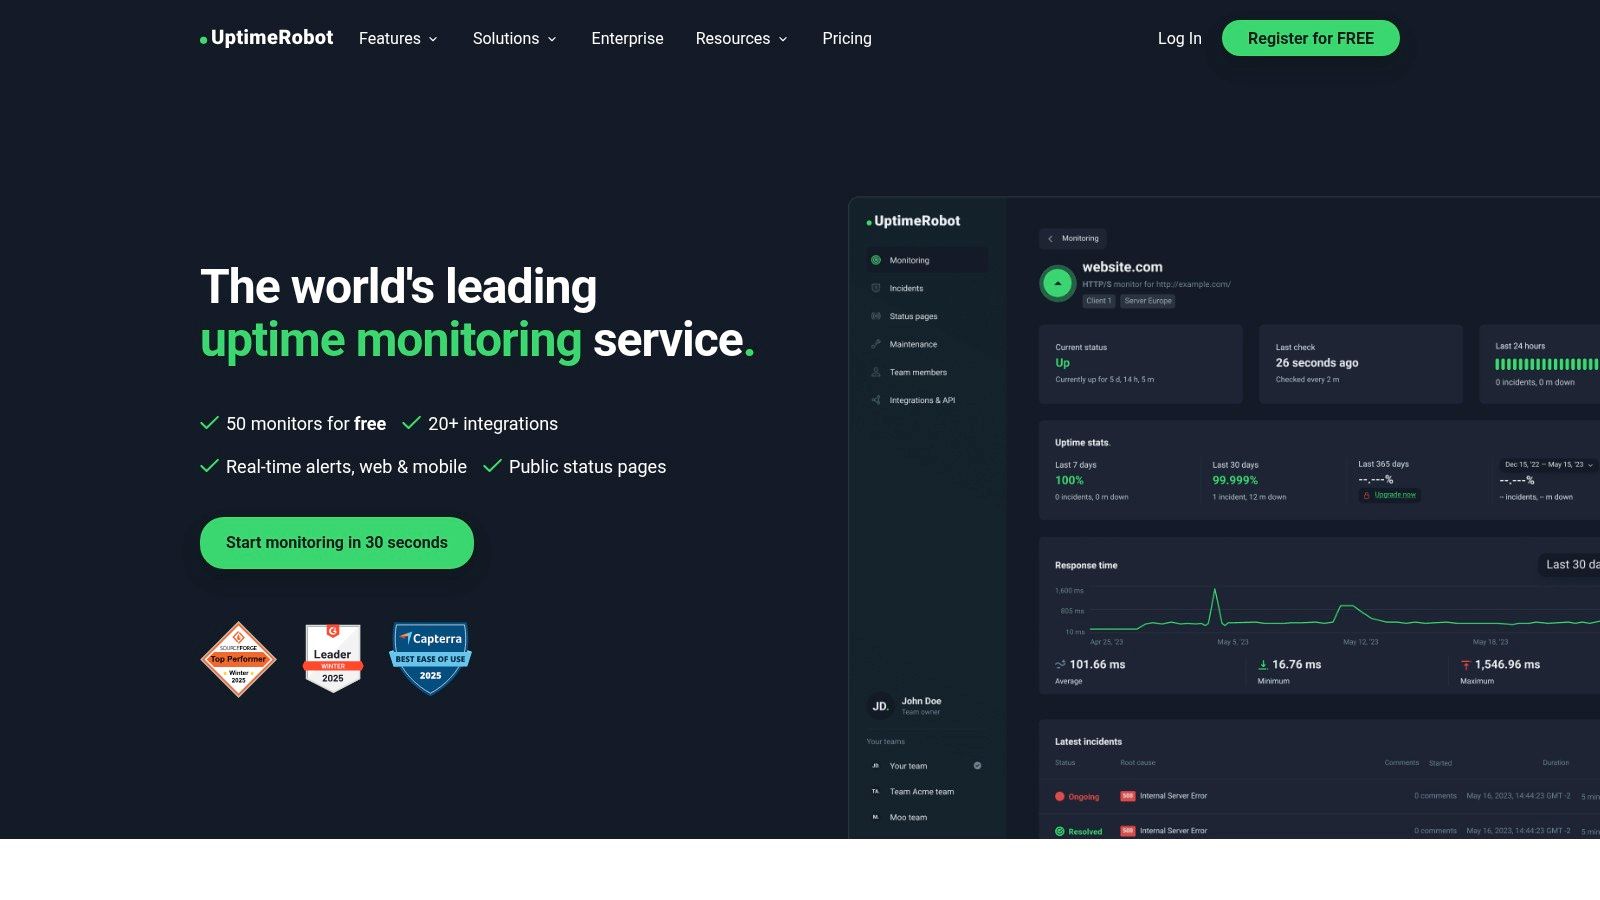
The platform provides a generous free tier that is often sufficient for personal projects, while its paid plans unlock faster monitoring intervals and more advanced features at a fraction of the cost of enterprise-level tools. It performs its checks from multiple global locations, helping to confirm if a site is truly down or just inaccessible from a specific region.
Key Features & Ideal Use Case
UptimeRobot is ideal for budget-conscious users who prioritize reliable uptime monitoring and status communication over in-depth performance diagnostics. It's perfect for quickly setting up alerts for a portfolio of client sites or a personal project without a significant financial investment. The keyword monitoring feature is particularly useful for ensuring not just that a page loads, but that it contains specific, expected content.
- Versatile Monitors: Check availability via HTTP(S), ping, port, and even by looking for specific keywords on a page.
- Fast Monitoring Intervals: Paid plans offer monitoring intervals as frequent as 30 to 60 seconds for near-instant downtime detection.
- Public Status Pages: Create and customize status pages, even using your own domain on higher-tier plans, to keep users informed.
- Flexible Alerting: Receive alerts through various channels, with SMS and voice call credits available as affordable add-ons.
Pros:
- Extremely affordable, with a highly functional free plan.
- Incredibly quick and easy to configure and deploy.
- Simple, no-frills dashboard that is easy to navigate.
Cons:
- Lacks the deep diagnostic capabilities of more comprehensive APM suites.
- Advanced features like faster check intervals and SSL monitoring are gated to paid tiers.
Website: https://uptimerobot.com
8. Catchpoint
Catchpoint is an enterprise-grade solution that offers one of the most comprehensive platforms among website performance monitoring tools. It provides deep visibility into every layer of the service delivery chain, from user devices to backend infrastructure. Its defining feature is its massive global network of monitoring nodes, which gives enterprises an unparalleled view of performance from virtually anywhere their customers are.
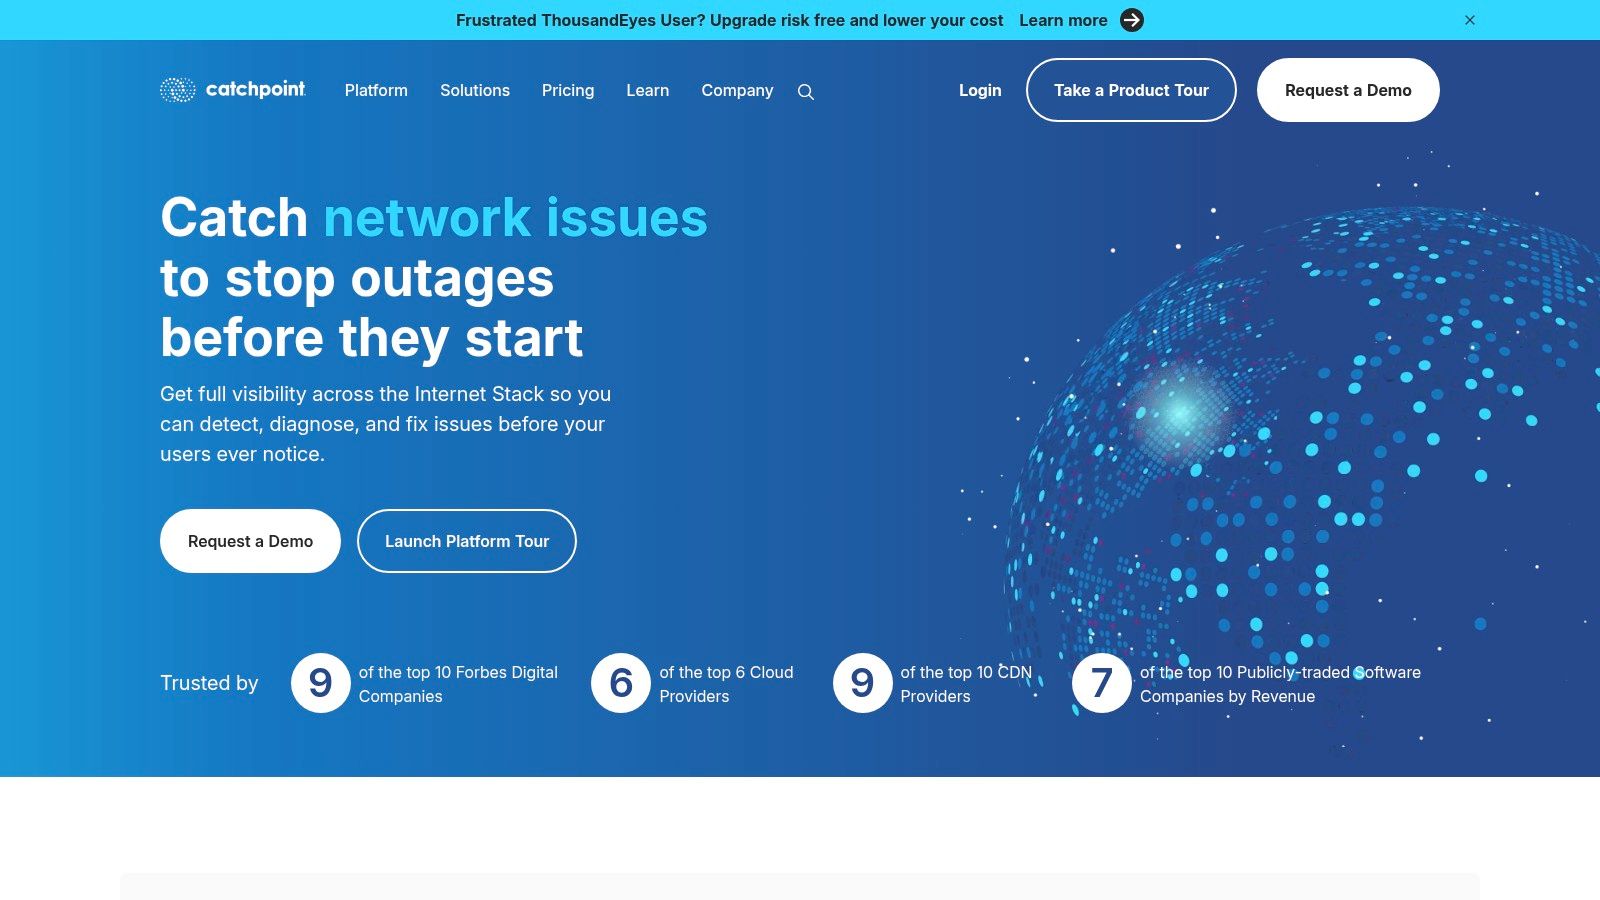
The platform is engineered for complex, distributed environments where performance issues can originate from third-party APIs, DNS, CDNs, or various network providers. Catchpoint excels at pinpointing the root cause of these elusive problems by correlating synthetic tests, real user data, network insights, and endpoint monitoring. This makes it a powerful diagnostic tool for DevOps and SRE teams managing critical digital services.
Key Features & Ideal Use Case
Catchpoint is ideal for large enterprises with a global user base and a complex technology stack that cannot afford any degradation in digital experience. Organizations that rely heavily on third-party services like CDNs, ad networks, or payment gateways will find its dependency mapping and last-mile visibility invaluable.
- Global Vantage Points: Monitor from over 3,000 nodes across backbone, cloud, last-mile, and wireless networks.
- Comprehensive Monitoring: Advanced synthetic, RUM, DNS, BGP, CDN, and API monitoring capabilities.
- Dependency Mapping: AI-powered insights to automatically detect and map service dependencies and identify root causes.
- Endpoint Monitoring: Gain visibility into employee device and application performance for remote workforces.
Pros:
- Exceptional and unmatched network vantage coverage for accurate global testing.
- Powerful diagnostic capabilities for troubleshooting complex, multi-layered applications.
- Granular data and insights for engineering and operations teams.
Cons:
- The pricing and feature set are heavily skewed towards enterprise-level users.
- Can require significant onboarding and engagement to leverage its full potential.
Website: https://www.catchpoint.com
9. SpeedCurve
SpeedCurve is a performance monitoring platform built for teams that prioritize the end-user experience. It uniquely connects synthetic monitoring with Real User Monitoring (RUM) data, focusing on design and front-end development workflows. Rather than just tracking uptime, SpeedCurve helps developers and designers visualize how performance impacts user perception and business metrics, making it a powerful tool for optimizing the entire customer journey.
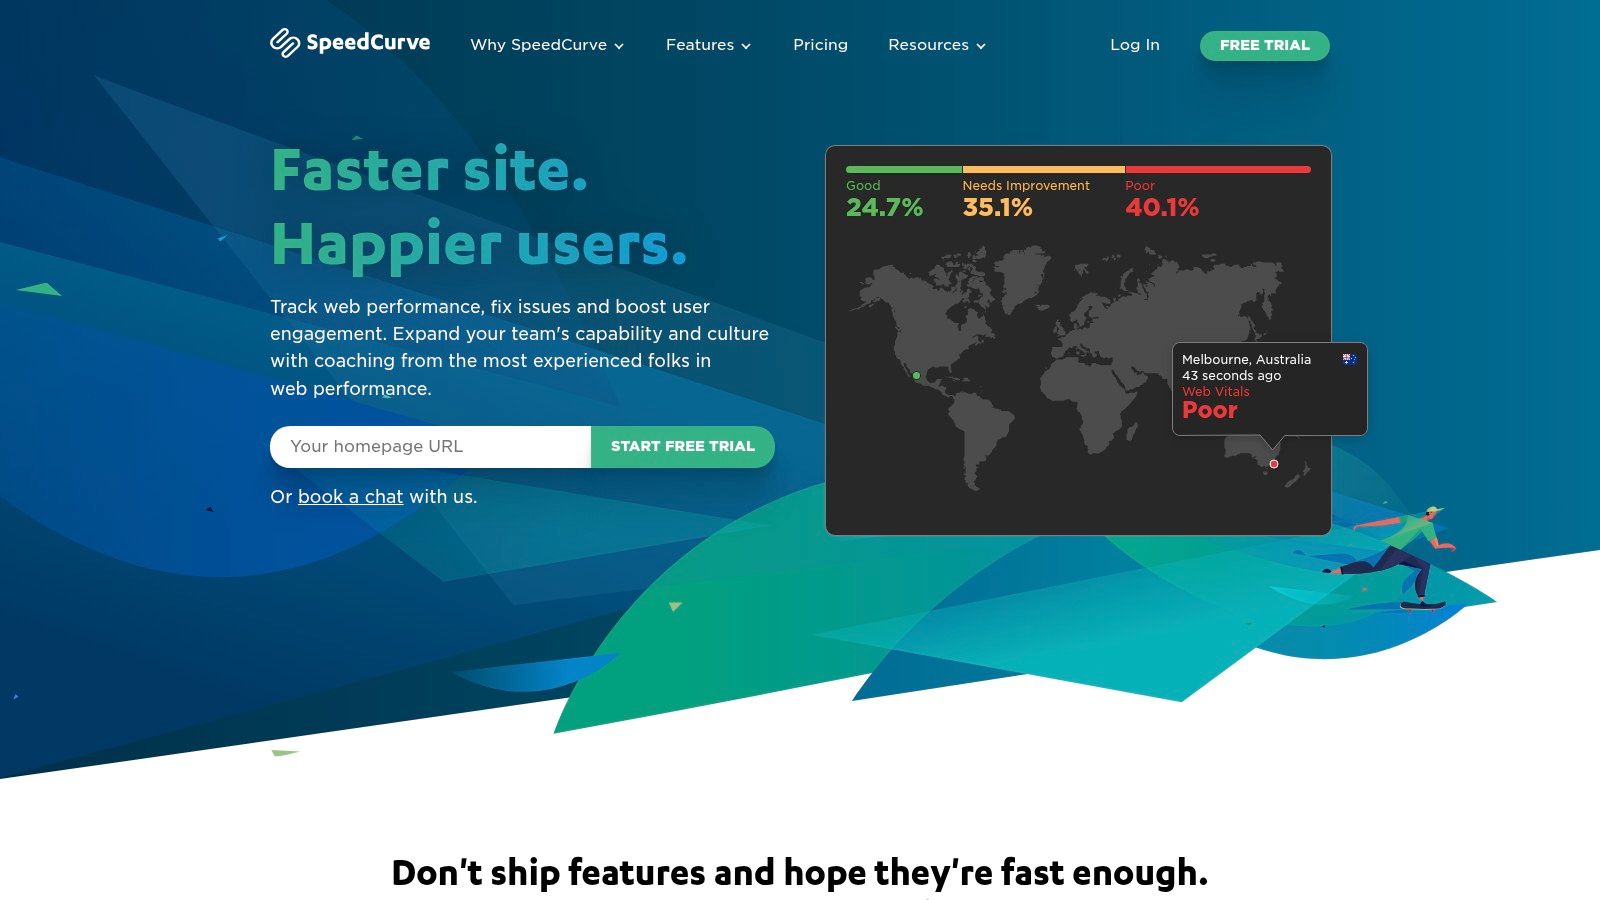
The platform stands out with its rich, visual data presentations, like filmstrip comparisons and video renderings of page loads. These features make it easier to communicate performance issues to non-technical stakeholders. Its concept of "performance budgets" allows teams to set performance goals (e.g., a Lighthouse score or a specific load time) and receive alerts when those budgets are exceeded, embedding performance accountability directly into the development cycle.
Key Features & Ideal Use Case
SpeedCurve is ideal for design-conscious development teams and e-commerce businesses that want to deeply understand the correlation between front-end performance and user engagement. Its focus on Core Web Vitals, custom timers, and A/B test comparisons makes it excellent for teams actively experimenting with and optimizing their user interface. The generous 13-month data retention on higher plans is a significant plus for long-term trend analysis.
- RUM and Synthetic Integration: Correlate lab data with real-world user data for a complete performance picture.
- Performance Budgets: Set and enforce performance goals with alerts to prevent regressions.
- Advanced Visualizations: Includes filmstrips and waterfall charts to diagnose front-end bottlenecks.
- UX & Business Metrics: Track Core Web Vitals, rendering metrics, and custom timers to link performance to business outcomes.
Pros:
- Excellent data visualizations make complex metrics easy to understand.
- Flexible metering allows you to combine RUM pageviews and synthetic checks as needed.
- Unlimited users and teams are supported on all plans, fostering collaboration.
Cons:
- The starting price point is higher than basic uptime or RUM-only tools.
- Some of the most powerful diagnostic features are reserved for higher-tier plans.
Website: https://www.speedcurve.com
10. GTmetrix
GTmetrix is a widely recognized name in the website performance monitoring tools space, primarily known for its detailed, on-demand page speed analysis. While it started as a simple testing tool, it has evolved into a robust platform offering scheduled monitoring and historical performance tracking, making it invaluable for developers and SEO specialists focused on granular page-level optimization. It provides an in-depth look at Core Web Vitals alongside its proprietary GTmetrix Grade.
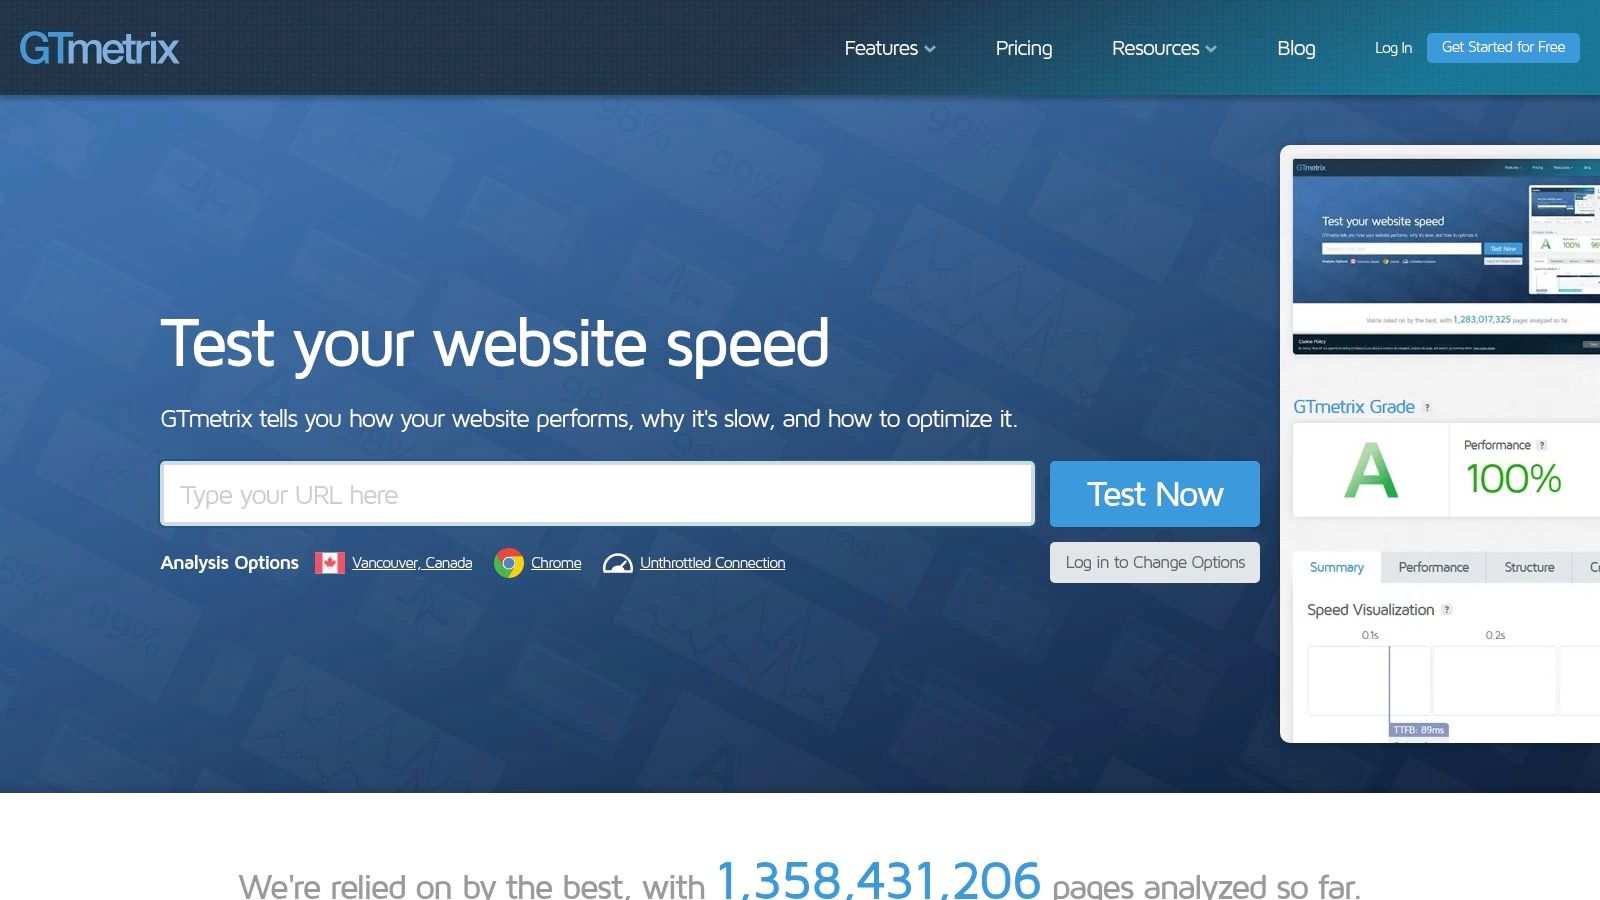
The platform's strength lies in its diagnostic capabilities. For any given URL, GTmetrix generates a comprehensive report that includes a waterfall chart, video recordings of the page load, and filmstrips. This visual feedback helps pinpoint exactly which elements are causing performance bottlenecks, from slow-loading scripts to unoptimized images, allowing for precise and effective optimization efforts.
Key Features & Ideal Use Case
GTmetrix is ideal for teams and individuals who need to perform deep-dive analysis on specific pages to improve load times and user experience scores. Its scheduled monitoring is perfect for tracking the performance of key landing pages or blog posts over time, with alerts to notify you of regressions after a new code deployment or content update.
- Scheduled Monitoring: Automate performance tests on a daily, weekly, or monthly basis and receive alerts when metrics fall below set thresholds.
- Detailed Reporting: Access waterfall charts, video playback, and filmstrips to visualize the page load process and identify issues.
- Global & Mobile Testing: Test your website's performance from over 20 global locations and simulate various mobile devices and connection speeds.
- API Access: Integrate performance testing into your development workflow or build custom reporting dashboards with API access on higher tiers.
Pros:
- Very accessible entry-level pricing, including a generous free plan.
- Excellent for detailed, page-by-page optimization and diagnostics.
- Clear and transparent usage quotas for tests and API calls.
Cons:
- Primarily focused on single-page analysis rather than complex, multi-step user journeys.
- API and monitoring quotas on lower-tier plans require careful management.
Website: https://gtmetrix.com
11. WebPageTest (by Catchpoint)
WebPageTest is an industry-standard, open-source tool, now powered by Catchpoint, that has long been the go-to for deep, technical performance analysis. It stands out by conducting tests from real browsers on real devices in diverse global locations, providing one of the most accurate pictures of how a site loads for actual users. This makes it an indispensable resource for developers and performance engineers who need granular, lab-based data to diagnose complex issues.
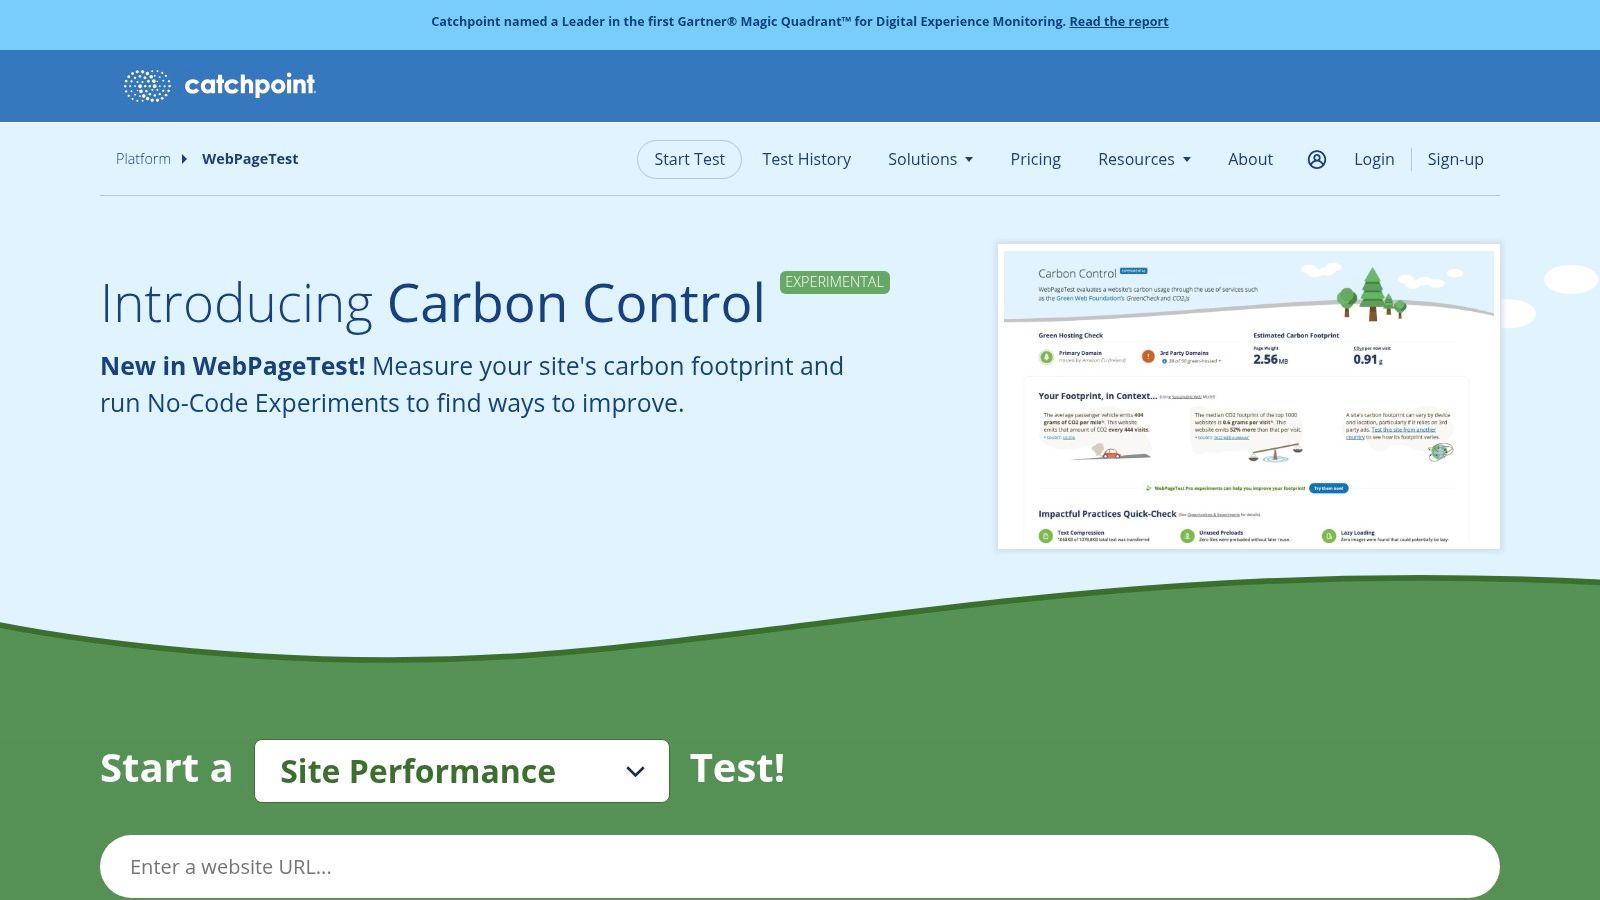
Unlike many other website performance monitoring tools that focus primarily on uptime, WebPageTest excels at providing in-depth diagnostics. It generates detailed waterfall charts, filmstrip views, and video captures of the page load process. It also fully integrates Google's Lighthouse audits, allowing you to run performance, accessibility, and SEO checks simultaneously within a single, powerful report.
Key Features & Ideal Use Case
WebPageTest is ideal for development teams and performance specialists who need to conduct detailed, one-off tests or integrate performance testing into their CI/CD pipeline. Its API allows for automated testing as part of a build process, ensuring new code doesn't introduce performance regressions. The level of detail provided is perfect for pinpointing specific render-blocking resources or optimizing Core Web Vitals.
- Real Browser Testing: Conduct tests using actual browsers like Chrome and Firefox from dozens of global locations on real hardware.
- Deep Diagnostics: Provides filmstrips, video capture, and detailed waterfall charts to visualize the loading sequence.
- Lighthouse Integration: Run comprehensive Lighthouse audits directly within the test results for a holistic performance score.
- CI/CD Integration: A robust API and GitHub Actions support allow for the automation of performance testing in development workflows.
Pros:
- Trusted, industry-standard measurements provide reliable data.
- Extremely deep diagnostic insights for granular problem-solving.
- Powerful free tier and strong CI/CD integration capabilities.
Cons:
- The interface can be less intuitive for non-technical users.
- Test-run quotas exist on both free and paid plans, which can limit high-volume testing.
Website: https://www.webpagetest.org
12. AWS Marketplace (Observability & Monitoring category)
AWS Marketplace isn't a single tool, but rather a centralized digital catalog where you can discover, purchase, and deploy a wide range of website performance monitoring tools directly within your AWS environment. This makes it a uniquely powerful resource for teams already invested in the AWS ecosystem. Instead of managing separate vendor contracts and billing cycles, you can consolidate everything through your existing AWS account, simplifying procurement and financial management significantly.
The platform’s "Observability & Monitoring" category is a curated collection of solutions from leading vendors like Datadog, New Relic, and Dynatrace, alongside niche players. This allows you to compare different website performance monitoring tools, take advantage of free trials, and deploy them with just a few clicks. It streamlines the evaluation process, as many listings are optimized for seamless integration with AWS services like EC2, Lambda, and RDS.
Key Features & Ideal Use Case
AWS Marketplace is ideal for organizations that want to centralize their software procurement and leverage their existing AWS commitment. It's particularly useful for DevOps and IT teams looking to quickly test and deploy new monitoring solutions without lengthy procurement cycles. The ability to find tools with pay-as-you-go pricing aligns perfectly with cloud consumption models.
- Curated Vendor Selection: Access a broad portfolio of monitoring solutions in a single, trusted location.
- Consolidated Billing: All software purchases are added to your monthly AWS bill, simplifying expense tracking.
- Easy Deployment: Many tools offer one-click deployment or AWS CloudFormation templates for rapid setup.
- Private Marketplace: Enterprises can create a customized catalog of approved software for their teams to ensure governance and compliance.
Pros:
- One-stop shopping for a wide variety of monitoring tools.
- Simplified billing and procurement integrated with your AWS account.
- Many listings offer free trials and flexible, cloud-friendly pricing.
Cons:
- You must have an AWS account to use the marketplace.
- Some listings are for professional services or require custom quotes rather than direct purchase.
Website: https://aws.amazon.com/marketplace/solutions/devops/observability-and-monitoring
Website Performance Monitoring Tools Comparison
| Solution | Core Features ✨ | User Experience ★★★★☆ | Value & Pricing 💰 | Target Audience 👥 | Unique Selling Points 🏆 |
|---|---|---|---|---|---|
| SolarWinds Pingdom | Uptime, page speed, RUM, alerts | Simple setup, strong reporting | Moderate, SMS costs may add up | SMBs to mid-market | Robust global probes, easy for non-tech |
| Datadog Synthetic Monitoring | API/browser/mobile tests, SLO alerting | Deep dashboards, strong integrations | Modular, can be pricey | Cloud-native teams, enterprises | 850+ integrations, scalable |
| New Relic (Synthetics + RUM) | Synthetic checks, browser monitoring, logs | Unified dashboards, flexible pricing | Usage-based billing, free tier | Broad: SMBs to enterprises | Generous free tier, all-in-one platform |
| Dynatrace (Digital Experience) | AI-driven full-stack, RUM, root-cause AI | Deep analytics, transparent pricing | Enterprise focused, volume costs | Large enterprises | AI insights with OneAgent |
| Site24x7 | Website, server, network, logs, RUM | SMB-friendly, all-in-one monitoring | Competitive, complex add-ons | SMBs | Free basic plan, US support |
| Uptrends | Global checkpoints, API & transaction builders | Intuitive UI, strong global presence | Credit-based pricing | Beginners, SMB teams | Easy transaction recorder |
| UptimeRobot | Basic uptime, HTTP(S), port monitors | Very affordable, quick start | Low cost, paid tiers for extras | Solo devs, small teams | Simple dashboards |
| Catchpoint | 3000+ vantage points, DNS/CDN/APIs | Enterprise-grade diagnostics | Enterprise pricing | Large enterprises | Best-in-class global network coverage |
| SpeedCurve | RUM + synthetic, UX metrics, 13-month storage | Excellent visuals, flexible plans | Higher starter price | Dev & UX teams | Performance budgets, unlimited users |
| GTmetrix | Page tests, video, mobile device testing | Low entry price, detailed insights | Affordable | Web developers & marketers | Scheduled testing, API |
| WebPageTest (Catchpoint) | Real browser tests, Lighthouse, CI/CD API | Trusted measurements, CI/CD integration | Free + Pro tiers | DevOps & performance teams | Real browser with advanced diagnostics |
| AWS Marketplace (Monitoring) | Curated tools, pay-as-you-go, trials | Centralized billing, easy AWS deployment | Varies by vendor | AWS users and enterprises | One-stop shop, AWS ecosystem integration |
Choosing the Right Tool for Your Performance Goals
Navigating the landscape of website performance monitoring tools can feel overwhelming. We've explored a dozen powerful solutions, from the straightforward uptime checks of UptimeRobot to the enterprise-grade, full-stack observability of platforms like Datadog and Dynatrace. The journey from simply knowing your site is online to understanding precisely how a user in Sacramento experiences your e-commerce checkout is the core challenge these tools solve. The single most important takeaway is that there is no universal 'best' tool; there is only the best tool for your specific business context.
Your selection process should not start with a feature list but with a clear definition of your performance objectives. A local home service provider in El Dorado Hills might find that a combination of GTmetrix for periodic Core Web Vitals checks and Pingdom for uptime alerts is perfectly sufficient. Conversely, a rapidly scaling e-commerce brand or a healthcare provider handling sensitive user data needs the sophisticated transaction monitoring and root-cause analysis offered by New Relic or Catchpoint to prevent revenue loss and maintain user trust.
A Practical Framework for Your Decision
To move from analysis to action, consider these critical factors. Your answers will illuminate which category of website performance monitoring tools aligns best with your organizational needs, technical maturity, and business goals.
- Define Your Primary Goal: What specific problem are you trying to solve? Is it basic availability (uptime), front-end speed (Core Web Vitals), complex user journey failures (transaction monitoring), or a complete view of your entire application stack (APM)? Your primary goal is your north star.
- Assess Your Technical Resources: Do you have a dedicated DevOps team that can leverage the deep, code-level insights from a tool like New Relic? Or are you a marketing leader who needs an intuitive dashboard that clearly visualizes performance metrics, like those found in Site24x7 or SpeedCurve? Be realistic about who will own and operate the tool.
- Consider Your Business Vertical: For businesses in regulated industries like healthcare or legal, ensuring website accessibility (ADA/WCAG compliance) and reliability is a matter of mitigating legal risk. Tools that can simulate user journeys and provide detailed waterfall charts, such as Dynatrace or WebPageTest, become invaluable for diagnosing issues that could impact accessibility.
- Evaluate Scalability and Integration: Your monitoring strategy must grow with you. If you're building on AWS, leveraging tools from the AWS Marketplace might offer seamless integration. If your marketing team relies on a complex stack of third-party scripts for PPC and remarketing, a Real User Monitoring (RUM) solution like Datadog's is essential for identifying which scripts are bogging down your site.
From Monitoring to Mastery
Ultimately, implementing one of these website performance monitoring tools is the first step. The real value emerges when you establish a culture of performance. This means creating feedback loops where insights from your monitoring tool inform your development sprints, content updates, and marketing campaigns. Performance is not a one-time project; it is an ongoing commitment to delivering a fast, reliable, and accessible user experience.
By choosing the right tool and integrating it into your daily operations, you are not just fixing technical issues. You are directly investing in higher conversion rates, stronger SEO rankings, improved brand perception, and a more inclusive digital presence for all your customers. The data these tools provide is your roadmap to building a website that doesn't just function, but truly performs.
Feeling overwhelmed by the data or unsure how to translate performance metrics into tangible business growth? The team at Site Igniters specializes in transforming performance insights into strategic advantages, from technical SEO and web design to ensuring full ADA/WCAG compliance. Let us help you choose, implement, and manage the right tools to build a faster, more reliable, and more profitable online presence. Learn more at Site Igniters.
Seth Sanders is the founder of Site Igniters, a digital marketing agency in El Dorado Hills, California.